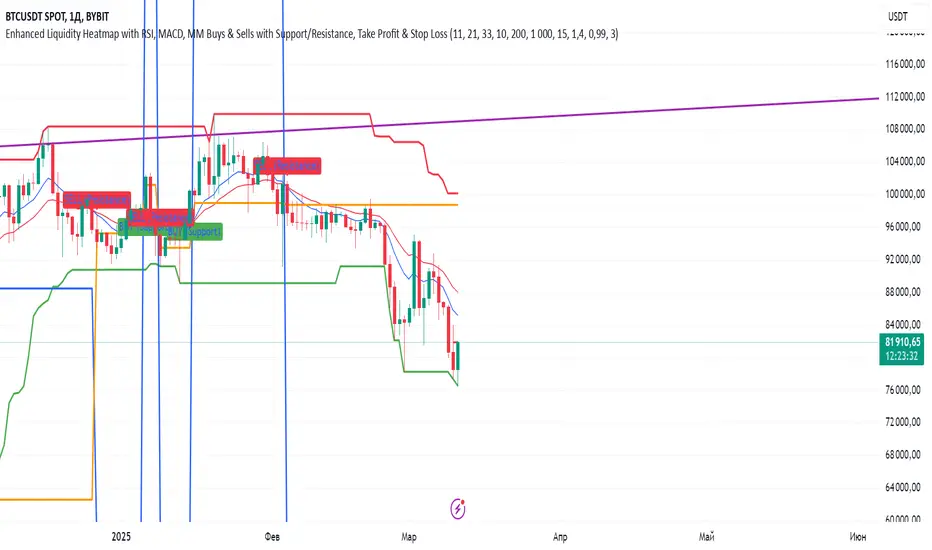
Indiq 2.0The functionality of the indicator includes the following features:
Moving Averages (MA):
The ability to adjust periods for short (short_ma_length) and long (long_ma_length) moving averages.
Display of moving averages on the chart:
Short MA (blue line).
Long MA (red line).
Generation of buy and sell signals:
Buy (BUY): When the short MA crosses the long MA from below.
Sell (SELL): When the short MA crosses the long MA from above.
Visualization of signals on the chart:
Buy is displayed as a green BUY marker below the candle.
Sell is displayed as a red SELL marker above the candle.
Liquidity Heatmap:
Liquidity levels:
Levels are calculated based on the closing price and a step (liquidity_step).
Levels are grouped by the nearest price values.
Volumes at levels:
Volume (volume) is accumulated for each liquidity level.
Levels with a volume less than min_volume_filter are not displayed.
Time filtering:
Levels that have not been updated within the last time_filter bars are not displayed.
Volatility filtering:
Levels are filtered by volatility (ATR) to exclude those outside the volatility range.
Color gradient:
The color of levels depends on volume (gradient from gradient_start_color to gradient_end_color).
Visualization:
Liquidity levels are displayed as horizontal lines.
Volumes at levels are shown as text labels.
RSI Filtering:
The ability to enable/disable RSI filtering (rsi_filter).
Liquidity levels are filtered based on overbought (rsi_overbought) and oversold (rsi_oversold) conditions.
Levels that do not meet RSI conditions are not displayed.
MACD Filtering:
The ability to enable/disable MACD filtering (macd_filter).
Liquidity levels are filtered based on the MACD histogram condition (e.g., only if the histogram is above zero).
Levels that do not meet MACD conditions are not displayed.
Display of Market Maker Buys:
Condition for market maker buys:
Volume exceeds the average volume over the last 20 bars by 2 times.
Closing price is above the opening price.
Market maker buys are displayed on the chart as orange MM Buy markers below the candle.
Indicator Settings:
Moving average parameters:
short_ma_length: Period for the short MA.
long_ma_length: Period for the long MA.
Liquidity heatmap parameters:
liquidity_step: Step between liquidity levels.
max_levels: Maximum number of levels to display.
time_filter: Time filter (last N bars).
min_volume_filter: Minimum volume for displaying a level.
volatility_filter: Volatility filter (ATR multiplier).
RSI parameters:
rsi_filter: Enable/disable RSI filtering.
rsi_overbought: Overbought RSI level.
rsi_oversold: Oversold RSI level.
MACD parameters:
macd_filter: Enable/disable MACD filtering.
Color settings:
gradient_start_color: Starting color of the gradient.
gradient_end_color: Ending color of the gradient.
Visualization:
Moving averages:
Short MA: Blue line.
Long MA: Red line.
Signals:
Buy: Green BUY marker.
Sell: Red SELL marker.
Liquidity heatmap:
Liquidity levels: Horizontal lines with a color gradient.
Volumes: Text labels at levels.
Market maker buys:
Orange MM Buy markers.
Alerts:
The ability to set alerts for signals:
Buy (BUY).
Sell (SELL).
Additional Features:
Flexible filter settings:
Filtering by time, volume, volatility, RSI, and MACD.
Extensibility:
The ability to add new filters (e.g., Stochastic, Volume Profile, etc.).
Visual customization:
Adjustment of colors, sizes, and display styles.
Summary:
The indicator provides a comprehensive tool for analyzing liquidity, generating trading signals, and tracking market maker activity. It combines:
A liquidity heatmap.
Signals based on moving averages.
Filtering by RSI and MACD.
Display of market maker buys.
Flexible settings and visualization.
This indicator is suitable for traders who want to analyze liquidity levels, identify entry and exit points, and monitor the actions of large market players.
"moving averages" için komut dosyalarını ara
SMA- Ashish SinghSMA
This script implements a Simple Moving Average (SMA) crossover strategy using three SMAs: 200-day, 50-day, and 20-day, with buy and sell signals triggered based on specific conditions involving these moving averages. The indicator is overlaid on the price chart, providing visual cues for potential buy and sell opportunities based on moving average crossovers.
Key Features:
Moving Averages:
The 200-day, 50-day, and 20-day SMAs are calculated and plotted on the price chart. These are key levels that traders use to assess trends.
The 200-day SMA represents the long-term trend, the 50-day SMA is used for medium-term trends, and the 20-day SMA is for short-term analysis.
Buy Signal:
A buy signal is triggered when the price is below all three moving averages (200 SMA, 50 SMA, 20 SMA) and the SMAs are in a specific downward trend (200 SMA > 50 SMA > 20 SMA). This is an indication of a potential upward reversal.
The buy signal is marked with a green triangle below the price bar.
Sell Signal:
A sell signal is triggered when the price is above all three moving averages and the SMAs are in a specific upward trend (200 SMA < 50 SMA < 20 SMA). This signals a potential downward reversal.
The sell signal is marked with a red triangle above the price bar.
Trade Information:
After a buy signal, the buy price, bar index, and timestamp are recorded. When a sell signal occurs, the percentage gain or loss is calculated along with the number of days between the buy and sell signals.
The script automatically displays a label on the chart showing the gain or loss percentage along with the number of days the trade lasted. Green labels represent gains, and red labels represent losses.
User-friendly Visuals:
The buy and sell signals are plotted as small triangles directly on the chart for easy identification.
Detailed trade information is provided with well-formatted labels to highlight the profit or loss after each trade.
How It Works:
This strategy helps traders to identify trend reversals by leveraging long-term and short-term moving averages.
A single buy or sell signal is triggered based on price movement relative to the SMAs and their order.
The tool is designed to help traders quickly spot buying and selling opportunities with clear visual indicators and gain/loss metrics.
This indicator is ideal for traders looking to implement a systematic SMA-based strategy with well-defined buy/sell points and automatic performance tracking for each trade.
Disclaimer: The information provided here is for educational and informational purposes only. It is not intended as financial advice or as a recommendation to buy or sell any stocks. Please conduct your own research or consult a financial advisor before making any investment decisions. ProfitLens does not guarantee the accuracy, completeness, or reliability of any information presented.

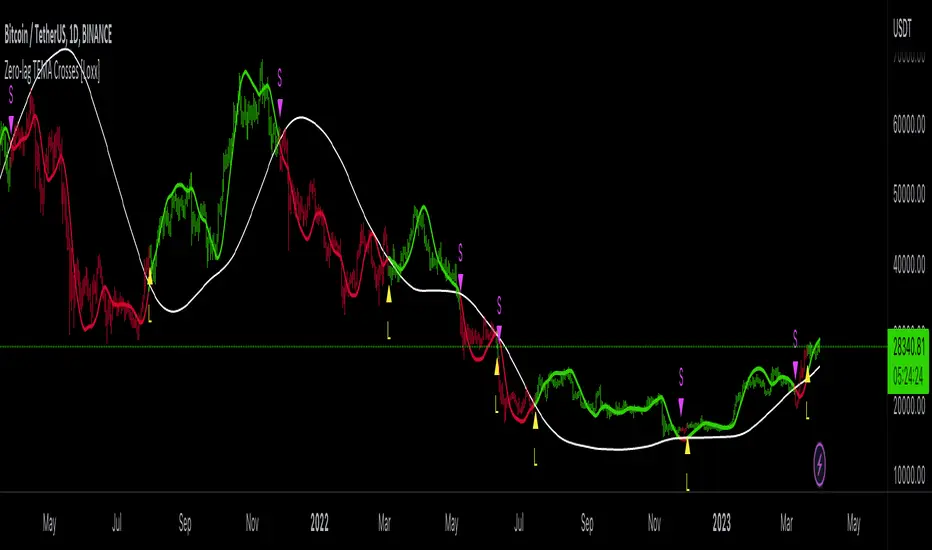
Zero-lag TEMA Crosses [Loxx]Zero-lag TEMA Crosses is a spinoff of a the Zero-lag MA as described by David Stendahl in the April 2000 issue of the journal "Technical Analysis of Stocks and Commodities". This indicator uses TEMA calculation mode in order to make the lag lesser compared to the original Zero-lag MA, and that makes this version even faster than the Zero-lag DEMA too. This indicator is the difference between a Fast and Slow Zero-lag TEMA. This indicator is very useful for lower timeframe scalping.
What is the Zero-lag MA?
The Zero-lag MA (Zero-Lag Moving Average) is a technical indicator that was introduced in the April 2000 issue of the journal "Technical Analysis of Stocks and Commodities" by David Stendahl.
The Zero-lag MA is a type of moving average (MA) that is designed to reduce or eliminate the lag that is typically associated with traditional moving averages. Moving averages are a widely used technical analysis tool that helps traders to identify trends and potential trading opportunities. They work by calculating the average price of a security over a given period of time, and then plotting that average on a chart. The most commonly used moving averages are simple moving averages (SMAs) and exponential moving averages (EMAs).
The problem with traditional moving averages is that they can be slow to respond to changes in market conditions. This lag can cause traders to miss out on potential trading opportunities, or to enter or exit trades at the wrong time. The Zero-lag MA was developed as a solution to this problem.
The Zero-lag MA is calculated using a combination of two EMAs and a subtraction formula. The first step in calculating the Zero-lag MA is to calculate two exponential moving averages: a fast EMA and a slow EMA. The fast EMA is calculated over a shorter period of time than the slow EMA. The exact period lengths will depend on the trader's preferences and the security being analyzed.
Once the two EMAs have been calculated, the next step is to take the difference between them. This difference represents the current market trend, with a positive value indicating an uptrend and a negative value indicating a downtrend. However, this difference alone is not enough to create a useful indicator, as it can still suffer from lag.
To further reduce lag, the difference between the two EMAs is multiplied by a factor derived from a third, slower EMA. This slower EMA acts as a smoothing factor, helping to reduce noise and make the indicator more accurate. The exact period length of the slower EMA will depend on the trader's preferences and the security being analyzed.
The final step in calculating the Zero-lag MA is to add the result of the multiplication to the fast EMA. This produces a final value that represents the current market trend with reduced lag. The Zero-lag MA can be plotted on a chart like any other moving average, and can be used to identify trends, potential trading opportunities, and support and resistance levels.
Overall, the Zero-lag MA is designed to provide traders with a more accurate representation of current market conditions by reducing the lag time between price changes and the moving average. By doing so, it can help traders to make more informed trading decisions and improve their overall profitability.
What is the TEMA?
The triple exponential moving average (TEMA) is a technical analysis indicator that was developed to reduce the lag of traditional moving averages, such as the simple moving average (SMA) or the exponential moving average (EMA). The TEMA was first introduced by Patrick Mulloy in the January 1994 issue of the "Technical Analysis of Stocks and Commodities" magazine.
The TEMA is a type of moving average that is calculated by applying multiple exponential smoothing techniques to price data. Unlike traditional moving averages, which apply a single smoothing factor to price data, the TEMA applies three smoothing factors to produce a more responsive and accurate indicator.
To calculate the TEMA, the following steps are taken:
Calculate the single exponential moving average (SMA) of the price data over a given period.
Calculate the double exponential moving average (DEMA) of the SMA over the same period.
Calculate the triple exponential moving average (TEMA) of the DEMA over the same period.
The formula for calculating the TEMA is:
TEMA = 3 * EMA(SMA) - 3 * EMA(EMA(SMA)) + EMA(EMA(EMA(SMA)))
where EMA is the exponential moving average and SMA is the simple moving average.
The TEMA is designed to reduce the lag associated with traditional moving averages by applying multiple smoothing factors to the price data. This helps to filter out short-term price fluctuations and provide a smoother indicator of the underlying trend. The TEMA is also less susceptible to whipsaws, which occur when a security's price moves in one direction and then quickly reverses, causing false trading signals.
The TEMA can be used in a variety of ways in technical analysis. It can be used to identify trends, determine support and resistance levels, and generate trading signals. When the TEMA is rising, it is generally interpreted as a bullish signal, indicating that the price is trending higher. When the TEMA is falling, it is generally interpreted as a bearish signal, indicating that the price is trending lower.
In summary, the TEMA is a more responsive and accurate indicator than traditional moving averages, designed to reduce lag and provide a smoother representation of the underlying trend. It is a useful tool for technical analysts and traders looking to identify trends, support and resistance levels, and potential trading opportunities.
Extras
Alerts
Bar coloring
Signals
Loxx's Expanded Source Types, see here:
Grease Trap V1.0The Grease Trap V1.0 indicator is a dynamic, Fibonacci-based strategy that calculates unique moving averages to generate trading signals. Below is an overview of its main components and functionality:
How It Works
Fibonacci Grouped Averages:
Dynamic Fibonacci Sequence:
The indicator uses a custom function that dynamically builds a Fibonacci sequence. The user can set the number of Fibonacci elements for two separate calculations:
One for the Indicator Average (default: 9 elements).
One for the Base Average (default: 14 elements).
Grouped Averaging:
Using these Fibonacci numbers, the script groups historical closing prices into segments. For each group (with a length determined by a Fibonacci number), it computes an average. These individual group averages are then averaged together to produce a single dynamic average.
Plotting and Visual Cues:
Two Lines:
The indicator plots two lines on the chart:
Primary Dynamic Fibonacci Grouped Average
Base Dynamic Fibonacci Grouped Average
Color Coding:
The colors of these lines change based on their relationship to the current high price and to each other. For example, if the primary average is above the high or crosses above the base average, it might be shown in green or yellow, whereas certain conditions trigger red, signaling caution.
Crossover Dots:
When the primary average crosses above the base (a bullish signal), a green dot is plotted. Conversely, when it crosses below (a bearish signal), a red dot is displayed. These dots help visually pinpoint the moments of potential trade entry or exit.
Trading Signals and Orders:
Buy Signal:
Triggered when the primary average crosses above the base average. On a buy signal:
If in a short position, it closes that position.
Then, it enters a long position.
Sell Signal:
Triggered when the primary average crosses below the base average. On a sell signal:
If in a long position, it closes that position.
Then, it enters a short position.
Profit Target Management:
The indicator includes automated profit management:
For long positions, it sets an exit order when the price rises by a user-defined percentage (default: 2%).
For short positions, it sets an exit order when the price falls by a similar percentage.
Alerts:
The script is equipped with alert conditions. Traders receive notifications whenever a buy or sell signal is generated, helping them stay on top of potential trading opportunities.
Customization
User Inputs:
Traders can adjust:
The number of Fibonacci elements for each average calculation.
Profit target percentages for both long and short positions.
Data Length Requirement:
The script ensures it uses at least 200 data points (or the total number of available bars, whichever is greater) for a robust calculation of the averages.
In Summary
The Grease Trap V1.0 indicator combines the mathematical elegance of Fibonacci sequences with dynamic grouped averaging. It offers:
Innovative Moving Averages: Based on Fibonacci groupings of historical price data.
Clear Visual Cues: Through color-coded lines and crossover dots.
Automated Trading Actions: With built-in order management and profit targets.
Alert Notifications: So traders are instantly aware of key market signals.
This makes the Grease Trap V1.0 a comprehensive tool for both signal generation and automated strategy execution, suitable for traders looking to integrate Fibonacci principles into their trading systems.

Price Imbalance as Consecutive Levels of AveragesOverview
The Price Imbalance as Consecutive Levels of Averages indicator is an advanced technical analysis tool designed to identify and visualize price imbalances in financial markets. Unlike traditional moving average (MA) indicators that update continuously with each new price bar, this indicator employs moving averages calculated over consecutive, non-overlapping historical windows. This unique approach leverages comparative historical data to provide deeper insights into trend strength and potential reversals, offering traders a more nuanced understanding of market dynamics and reducing the likelihood of false signals or fakeouts.
Key Features
Consecutive Rolling Moving Averages: Utilizes three distinct simple moving averages (SMAs) calculated over consecutive, non-overlapping windows to capture different historical segments of price data.
Dynamic Color-Coded Visualization: SMA lines change color and style based on the relationship between the averages, highlighting both extreme and normal market conditions.
Median and Secondary Median Lines: Provides additional layers of price distribution insight during normal trend conditions through the plotting of primary and secondary median lines.
Fakeout Prevention: Filters out short-term volatility and sharp price movements by requiring consistent historical alignment of multiple moving averages.
Customizable Parameters: Offers flexibility to adjust SMA window lengths and line extensions to align with various trading strategies and timeframes.
Real-Time Updates with Historical Context: Continuously recalculates and updates SMA lines based on comparative historical windows, ensuring that the indicator reflects both current and past market conditions.
Inputs & Settings
Rolling Window Lengths:
Window 1 Length (Most Recent) Bars: Number of bars used to calculate the most recent SMA. (Default: 5, Range: 2–300)
Window 2 Length (Preceding) Bars: Number of bars for the second SMA, shifted by Window 1. (Default: 8, Range: 2–300)
Window 3 Length (Third Rolling) Bars: Number of bars for the third SMA, shifted by the combined lengths of Window 1 and Window 2. (Default: 13, Range: 2–300)
Horizontal Line Extension:
Horizontal Line Extension (Bars): Determines how far each SMA line extends horizontally on the chart. (Default: 10 bars, Range: 1–100)
Functionality and Theory
1. Calculating Consecutive Simple Moving Averages (SMAs):
The indicator calculates three SMAs, each based on distinct and consecutive historical windows of price data. This approach contrasts with traditional MAs that continuously update with each new price bar, offering a static view of past trends rather than an ongoing one.
Mean1 (SMA1): Calculated over the most recent Window 1 Length bars. Represents the short-term trend.
Mean1=∑i=1N1CloseiN1
Mean1=N1∑i=1N1Closei
Where N1N1 is the length of Window 1.
Mean2 (SMA2): Calculated over the preceding Window 2 Length bars, shifted back by Window 1 Length bars. Represents the medium-term trend.
\text{Mean2} = \frac{\sum_{i=1}^{N_2} \text{Close}_{i + N_1}}}{N_2}
Where N2N2 is the length of Window 2.
Mean3 (SMA3): Calculated over the third rolling Window 3 Length bars, shifted back by the combined lengths of Window 1 and Window 2 bars. Represents the long-term trend.
\text{Mean3} = \frac{\sum_{i=1}^{N_3} \text{Close}_{i + N_1 + N_2}}}{N_3}
Where N3N3 is the length of Window 3.
2. Determining Market Conditions:
The relationship between the three SMAs categorizes the market condition into either extreme or normal states, enabling traders to quickly assess trend strength and potential reversals.
Extreme Bullish:
Mean3Mean2>Mean1
Mean3>Mean2>Mean1
Indicates a strong and sustained downward trend. SMA lines are colored purple and styled as dashed lines.
Normal Bullish:
Mean1>Mean2andnot in extreme bullish condition
Mean1>Mean2andnot in extreme bullish condition
Indicates a standard upward trend. SMA lines are colored green and styled as solid lines.
Normal Bearish:
Mean1Mean2>Mean1
Mean3>Mean2>Mean1
Normal Bullish:
Mean1>Mean2andnot in Extreme Bullish
Mean1>Mean2andnot in Extreme Bullish
Normal Bearish:
Mean1 Mean2 > Mean3
Visualization: All three SMAs are displayed as gold dashed lines.
Median Lines: Not displayed to maintain chart clarity.
Interpretation: Indicates a strong and sustained upward trend. Traders may consider entering long positions, confident in the trend's strength without the distraction of additional lines.
2. Normal Bullish Condition:
SMAs Alignment: Mean1 > Mean2 (not in extreme condition)
Visualization: Mean1 and Mean2 are green solid lines; Mean3 is gray.
Median Lines: A thin blue dotted median line is plotted between Mean1 and Mean2, with two additional thin blue dashed lines as secondary medians.
Interpretation: Confirms an upward trend while providing deeper insights into price distribution. Traders can use the median and secondary median lines to identify optimal entry points and manage risk more effectively.
3. Extreme Bearish Condition:
SMAs Alignment: Mean3 > Mean2 > Mean1
Visualization: All three SMAs are displayed as purple dashed lines.
Median Lines: Not displayed to maintain chart clarity.
Interpretation: Indicates a strong and sustained downward trend. Traders may consider entering short positions, confident in the trend's strength without the distraction of additional lines.
4. Normal Bearish Condition:
SMAs Alignment: Mean1 < Mean2 (not in extreme condition)
Visualization: Mean1 and Mean2 are red solid lines; Mean3 is gray.
Median Lines: A thin blue dotted median line is plotted between Mean1 and Mean2, with two additional thin blue dashed lines as secondary medians.
Interpretation: Confirms a downward trend while providing deeper insights into price distribution. Traders can use the median and secondary median lines to identify optimal entry points and manage risk more effectively.
Customization and Flexibility
The Price Imbalance as Consecutive Levels of Averages indicator is highly adaptable, allowing traders to tailor it to their specific trading styles and market conditions through adjustable parameters:
SMA Window Lengths: Modify the lengths of Window 1, Window 2, and Window 3 to capture different historical trend segments, whether focusing on short-term fluctuations or long-term movements.
Line Extension: Adjust the horizontal extension of SMA and median lines to align with different trading horizons and chart preferences.
Color and Style Preferences: While default colors and styles are optimized for clarity, traders can customize these elements to match their personal chart aesthetics and enhance visual differentiation.
This flexibility ensures that the indicator remains versatile and applicable across various markets, asset classes, and trading strategies, providing valuable insights tailored to individual trading needs.
Conclusion
The Price Imbalance as Consecutive Levels of Averages indicator offers a comprehensive and innovative approach to analyzing price trends and imbalances within financial markets. By utilizing three consecutive, non-overlapping SMAs and incorporating median lines during normal trend conditions, the indicator provides clear and actionable insights into trend strength and price distribution. Its unique design leverages comparative historical data, distinguishing it from traditional moving averages and enhancing its utility in identifying genuine market movements while minimizing false signals. This dynamic and customizable tool empowers traders to refine their technical analysis, optimize their trading strategies, and navigate the markets with greater confidence and precision.

WODIsMA Strategy 3 MA Crossover & Bull-Bear Trend ConfirmationWODIsMA Strategy is a versatile trading strategy designed to leverage the strength of moving averages and volatility indicators to provide clear trading signals for both long and short positions. This strategy is suitable for traders looking for a systematic approach to trading with adjustable parameters to fit various market conditions and personal trading styles.
Key Features
Customizable Moving Averages:
The strategy allows users to select different types of moving averages (SMA, EMA, SMMA, WMA, VWMA) for short-term, mid-term, long-term, and bull-bear trend identification.
Each moving average can be customized with different lengths, sources (e.g., close, high, low), timeframes, and colors.
Position Management:
Users can specify the percentage of capital to use per trade and the percentage to close per partial exit.
The strategy supports both long and short positions with the ability to enable or disable each direction.
Volatility Filter:
Incorporates a volatility filter to ensure trades are only taken when market volatility is above a user-defined threshold, enhancing the strategy's effectiveness in dynamic market conditions.
Bull-Bear Trend Line:
Option to enable a bull-bear trend line that helps identify the overall market trend. Trades are taken based on the relationship between the long-term moving average and the bull-bear trend line.
Partial Exits and Full Close Logic:
The strategy includes logic for partial exits based on the crossing of mid-term and long-term moving averages.
Ensures that positions are fully closed when adverse conditions are detected, such as the price crossing below the bull-bear trend line.
Stop Loss Management:
Implements user-defined stop loss levels to manage risk effectively. The stop loss is dynamically adjusted based on the entry price and user input.
Detailed Description
Moving Average Calculation: The strategy calculates up to six different moving averages, each with customizable parameters. These moving averages help identify the short-term, mid-term, long-term trends, and overall market direction.
Trading Signals:
Long Signal: A long position is opened when the short-term moving average is above the long-term moving average, and the mid-term moving average crosses above the long-term moving average.
Short Signal: A short position is opened when the short-term moving average is below the long-term moving average, and the mid-term moving average crosses below the long-term moving average.
Volatility Condition: The strategy includes a volatility filter that activates trades only when volatility exceeds a specified threshold, ensuring trades are made in favorable market conditions.
Bull-Bear Trend Confirmation: When enabled, trades are filtered based on the relationship between the long-term moving average and the bull-bear trend line, adding another layer of confirmation.
Stop Loss and Exits:
The strategy manages risk by placing stop loss orders based on user-defined percentages.
Positions are partially or fully closed based on the crossing of moving averages and the relationship with the bull-bear trend line.
Originality and Usefulness
This strategy is original as it combines multiple moving averages and volatility indicators in a structured manner to provide reliable trading signals. Its versatility allows traders to adjust the parameters to match their trading preferences and market conditions. The inclusion of a volatility filter and bull-bear trend line adds significant value by reducing false signals and ensuring trades are taken in the direction of the overall market trend. The detailed descriptions and customizable settings make this strategy accessible and understandable for traders, even those unfamiliar with the underlying Pine Script code.
By providing clear entry, exit, and risk management rules, the WODIsMA Strategy enhances the trader's ability to navigate different market environments, making it a valuable addition to the TradingView community scripts.

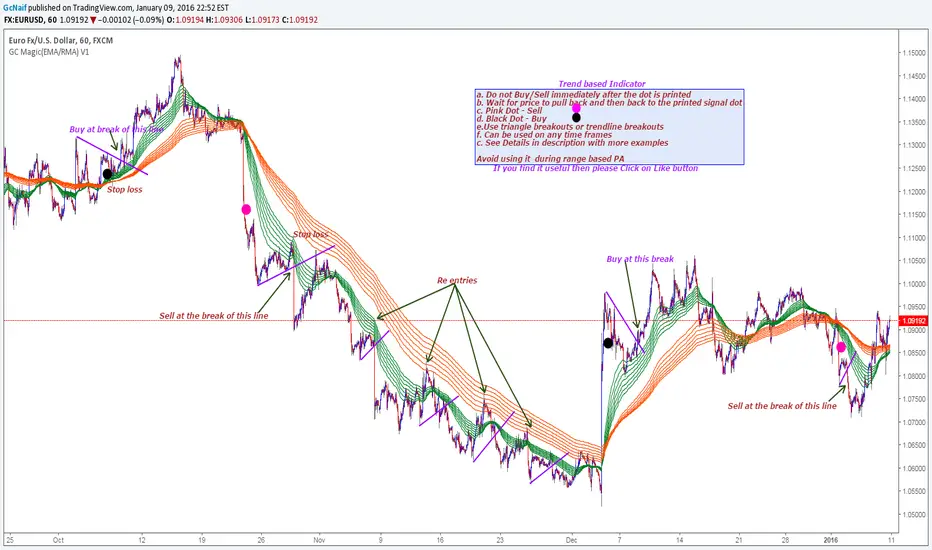
GC Magic(EMA/RMA) V1This is the second script I am posting on TV . This is a Trend based indicator with the option of using it as Exponential Moving Averages or Rsi Moving Averages.The RMA's are giving better signal than the Exponential Moving Averages. The script has the option to select either of them. Works on all time frames. The default options are working good on all time frames.
With the help of Indicator Properties following Options can be changed
a. Type of moving averages for using Guppy method
b. Option to use higher time frame Signal moving average of your choice along with higher time frame
c. Enable or disable to show signal EMA/RMA on chart .
d. Enable or disable to show Guppy EMA/RMA on chart
Indicator Properties:
1. Select to use EMA , Uncheck to use RMA: --> Check to Select EMA based Guppy or Uncheck to use RMA based Guppy
2. Fast EMA/RMA For Cross --> Fast EMA/RMA cross Length
3. Slow EMA/RMA For Cross --> Slow EMA/RMA Length
4. Signal EMA/RMA --> Moving average to use for Signal filters. This moving average will be based on the timeframe u will be selecting below
5. Time interval for Signal EMA/RMA (W, D, ) --> Which time frame moving average you want for the above Signal EMA
6. Do you want to use Signal EMA/RMA for Signals? --> Do you want to use Signal EMA as filter or just the cross of Guppy . Check to use and uncheck for just cross
7. Show Signal EMA on Chart? --> Do you want to display higher timeframe Signal EMA on chart
8. Show Guppy-Slow-Red On Chart? --> Shows/Hides Slow EMA/RMAs
9. Show Guppy-Fast-Green On Chart? --> Shows/Hides Fast EMA/RMAs
Examples:
GbpAud 15m
GbpNzd 1hr
Oil 4hr
AudUSD 1hr
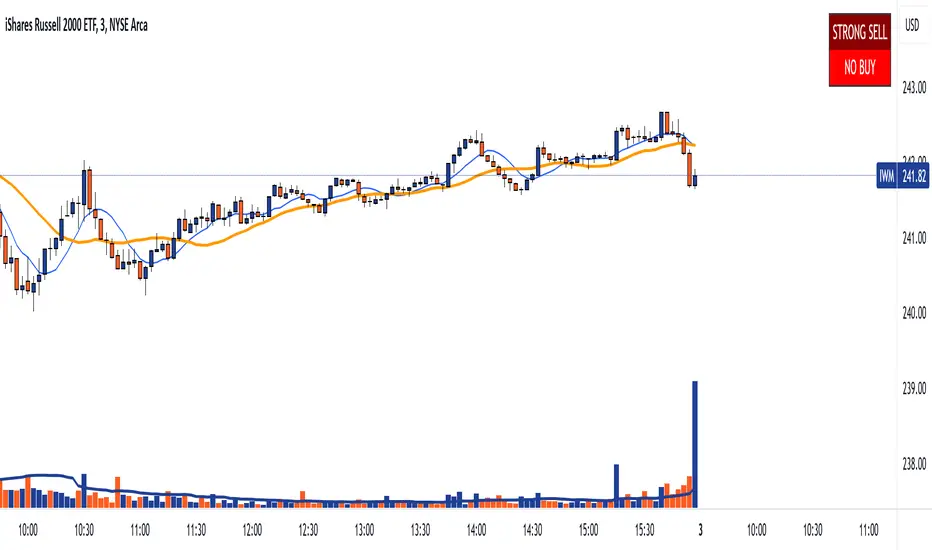
DTS- Dynamic Trend SignalDynamic Trend Signal
The Dynamic Trend Signal indicator is a powerful and highly customizable tool designed for traders who want clear and actionable signals to guide their trading decisions. This indicator leverages the relationship between two moving averages and the current price to provide concise buy/sell recommendations while visually enhancing your chart with professional-grade features.
Key Features:
Actionable Trading Signals:
STRONG BUY / NO SELL: When the price is above both moving averages.
BUY / NO SELL: When the price is above the longer moving average but below the shorter moving average.
NO BUY / SELL: When the price is below the longer moving average but above the shorter moving average.
STRONG SELL / NO BUY: When the price is below both moving averages.
Dynamic Signal Table:
Displays real-time trading signals in a convenient table format.
Automatically updates based on market conditions.
Customizable table position (top-left, top-right, bottom-left, or bottom-right).
Dynamic background and text colors for improved visibility:
Green shades for bullish signals.
Red shades for bearish signals.
Customizable Moving Averages:
Configure each moving average independently:
Choose between Simple Moving Average (SMA) and Exponential Moving Average (EMA).
Set unique lengths, colors, and line thickness for each average.
Default settings:
MA1: Short-term (8-period) with thickness 1.
MA2: Long-term (20-period) with thickness 2.
Optional Crossover Alerts:
Visual and textual alerts for moving average crossovers:
BUY: When the shorter moving average crosses above the longer moving average.
SELL: When the shorter moving average crosses below the longer moving average.
Crossover alerts are disabled by default but can be easily enabled in settings.
Ease of Use:
Intuitive interface with clean and professional visuals.
Fully customizable to fit any trading strategy or chart style.
How It Helps Traders:
The Dynamic Trend Signal simplifies market analysis by removing guesswork and focusing on clear, data-driven signals. Whether you're a beginner looking for straightforward guidance or an experienced trader seeking to enhance your strategy, this indicator provides:
Confidence in decision-making with clear buy/sell signals.
Customization to align with your unique trading approach.
Clarity through visually appealing, color-coded signals and alerts.
Ideal For:
Swing Traders
Day Traders
Trend Followers
Traders looking to integrate a dynamic, rule-based approach to their analysis.
How to Use:
Add the Dynamic Trend Signal indicator to your chart.
Adjust the moving average lengths, types, colors, and thickness to suit your trading strategy.
Monitor the signal table for actionable recommendations.
Optionally enable crossover alerts for real-time buy/sell notifications.
Unlock the power of clear and actionable trading signals with the Dynamic Trend Signal! Add it to your TradingView chart today and take your trading strategy to the next level.
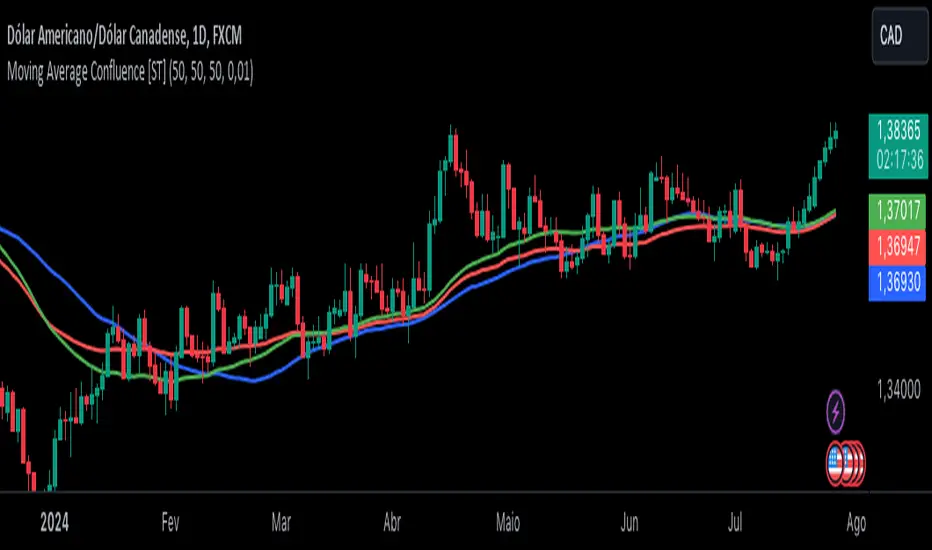
Moving Average Confluence [ST]Moving Average Confluence
Description in English:
This indicator uses multiple moving averages (SMA, EMA, WMA) with different periods to identify confluence points that can indicate support or resistance zones.
Detailed Explanation:
Configuration:
SMA Length: This input defines the period for the Simple Moving Average (SMA). The default value is 50.
EMA Length: This input defines the period for the Exponential Moving Average (EMA). The default value is 50.
WMA Length: This input defines the period for the Weighted Moving Average (WMA). The default value is 50.
Confluence Threshold: This input defines the maximum allowable difference between the moving averages to consider them in confluence. The default value is 0.01.
Calculation of Moving Averages:
SMA: Calculated as the simple arithmetic mean of the closing prices over the specified period.
EMA: Calculated by giving more weight to recent prices.
WMA: Calculated by weighting the closing prices based on their age.
Identification of Confluence:
Confluence is identified when the differences between SMA, EMA, and WMA are all within the specified threshold. This can indicate potential support or resistance zones.
Plotting:
The SMA, EMA, and WMA are plotted with different colors for easy identification.
Confluence points are marked with yellow labels on the chart.
Indicator Benefits:
Support and Resistance Identification: Helps traders identify potential support and resistance zones through the confluence of different moving averages.
Visual Cues: Provides clear visual signals for confluence points, aiding in making informed trading decisions.
Customizable Parameters: Allows traders to adjust the periods of the moving averages and the confluence threshold to suit different trading strategies and market conditions.
Justification of Component Combination:
Combining multiple types of moving averages (SMA, EMA, WMA) provides a comprehensive view of market trends. Identifying confluence points where these averages are close together can indicate strong support or resistance levels.
How Components Work Together:
The script calculates the SMA, EMA, and WMA for the specified periods.
It then checks if the differences between these moving averages are within the specified threshold.
When a confluence is detected, it is marked on the chart with a yellow label, providing a clear visual signal to the trader.
Título: Confluência de Médias Móveis
Descrição em Português:
Este indicador utiliza várias médias móveis (SMA, EMA, WMA) com diferentes períodos para identificar pontos de confluência que podem indicar zonas de suporte ou resistência.
Explicação Detalhada:
Configuração:
Comprimento da SMA: Este parâmetro define o período para a Média Móvel Simples (SMA). O valor padrão é 50.
Comprimento da EMA: Este parâmetro define o período para a Média Móvel Exponencial (EMA). O valor padrão é 50.
Comprimento da WMA: Este parâmetro define o período para a Média Móvel Ponderada (WMA). O valor padrão é 50.
Limite de Confluência: Este parâmetro define a diferença máxima permitida entre as médias móveis para considerá-las em confluência. O valor padrão é 0.01.
Cálculo das Médias Móveis:
SMA: Calculada como a média aritmética simples dos preços de fechamento ao longo do período especificado.
EMA: Calculada atribuindo mais peso aos preços mais recentes.
WMA: Calculada ponderando os preços de fechamento com base em sua idade.
Identificação de Confluência:
A confluência é identificada quando as diferenças entre SMA, EMA e WMA estão todas dentro do limite especificado. Isso pode indicar potenciais zonas de suporte ou resistência.
Plotagem:
A SMA, EMA e WMA são plotadas com cores diferentes para fácil identificação.
Pontos de confluência são marcados com etiquetas amarelas no gráfico.
Benefícios do Indicador:
Identificação de Suporte e Resistência: Ajuda os traders a identificar potenciais zonas de suporte e resistência através da confluência de diferentes médias móveis.
Sinais Visuais Claros: Fornece sinais visuais claros para pontos de confluência, auxiliando na tomada de decisões informadas.
Parâmetros Personalizáveis: Permite que os traders ajustem os períodos das médias móveis e o limite de confluência para se adequar a diferentes estratégias de negociação e condições de mercado.
Justificação da Combinação de Componentes:
Combinar vários tipos de médias móveis (SMA, EMA, WMA) fornece uma visão abrangente das tendências do mercado. Identificar pontos de confluência onde essas médias estão próximas pode indicar níveis fortes de suporte ou resistência.
Como os Componentes Funcionam Juntos:
O script calcula a SMA, EMA e WMA para os períodos especificados.
Em seguida, verifica se as diferenças entre essas médias móveis estão dentro do limite especificado.
Quando uma confluência é detectada, ela é marcada no gráfico com uma etiqueta amarela, fornecendo um sinal visual claro para o trader.
Buying - Selling StrengthThis script is designed as a TradingView indicator called "Buying Selling Volume". It aims to provide insights into buying and selling pressures in the market, along with the comparison of these pressures against moving averages.
Calculation of Buying and Selling Volumes:
Buying Volume (BV) is calculated based on the difference between the close price and the low price, weighted by the volume traded.
Selling Volume (SV) is calculated based on the difference between the high price and the close price, weighted by the volume traded.
These volumes are normalized to ensure positive values.
Plotting of Buying and Selling Volumes:
The script plots the Buying Volume (green) and Selling Volume (red) on the chart using vertical bars.
Each bar represents the relative strength of buying or selling pressure at a given point in time.
Moving Averages Calculation:
Users can select the type of moving average (SMA, EMA, WMA, or VWMA) and the length of each moving average.
Moving averages are calculated for both buying and selling volumes based on the selected parameters.
Plotting of Moving Averages:
The script plots the selected moving averages for buying (blue) and selling (orange) volumes on the chart.
These moving averages provide smoothed representations of the underlying volume trends.
Bar Color and Background Color:
The script dynamically adjusts the color of the bars and the background based on specific conditions:
If both buying and selling volumes are above their respective moving averages, the bar color is green, indicating a bullish signal.
If both volumes are below their moving averages, the bar color is red, indicating a bearish signal.
If buying volume is above its moving average while selling volume is below its moving average, the bar color is yellow, suggesting mixed market sentiment.
Otherwise, the bar color is gray, indicating a neutral market condition.

[blackcat] L3 YACD38Level 3
Background
"3/8 moving average" golden cross enters, and dead cross exits.
Function
This set of methods is an improved moving average usage - "38 moving average usage", we need to use three moving averages:
3-day, 8-day and 21-day moving averages.
Why is it the 3-day, 8-day, and 21-day moving averages? Most of my friends may not be clear. 3, 8, and 21 are all Fibonacci numbers, also known as the golden section numbers. The Fibonacci number is a basic pattern of nature, which exists in all things. If you don’t understand it, you can go to a certain degree to understand it. In short, it is a very magical existence.
Keep in mind the principle of only doing uptrends and not downtrends. Then we have to use our 21-day moving average skillfully. The 21-day moving average happens to be the average price line for one month. We take it as the decision-making line. When the decision-making line goes down or goes flat, we mainly wait and see; , the operation success rate is higher!
Let's directly share the technical points of "38 moving average usage":
1. Entry point: the 3-day line crosses the 8-day line to form a golden cross, or both the 3-day and 8-day line cross the 21-day moving average; the position of the golden cross must be above the 21-day moving average, and it is invalid if it is below;
2. Basis for holding shares: After entering the market, the moving averages are arranged in a long position, and the K-line rises along the 3-day and 8-day moving averages, hold it patiently, and sell for whatever reason you buy!
3. Exit point: When the 3-day moving average crosses the 8-day moving average to form a dead cross, or the 3-day and 8-day moving averages break below the 21-day moving average, then decisively leave the market;
Note: "38 moving average usage" only needs to refer to the moving average, and the other most reference quantities can be changed. As long as the above conditions are met, you can boldly intervene, and after the intervention, you will rise to the top! Don't underestimate the usage of this set of moving averages, carefully comprehend and memorize them by heart, and be able to achieve the unity of knowledge and action, and you will be able to stand up and be the master from now on!
Remarks
Feedbacks are appreciated.

EMA/SMA Distance Percentage TableThis TradingView indicator, "EMA/SMA Distance Percentage Table," is designed to help traders and analysts quickly assess the current price's relationship to key Exponential Moving Averages (EMAs) and Simple Moving Averages (SMAs).
Here's a breakdown of what it does:
Calculates Multiple Moving Averages: It computes EMAs for lengths 10, 30, 50, and 200, and SMAs for lengths 50 and 200. These are commonly used moving averages in technical analysis.
Measures Percentage Distance: For each of these moving averages, it calculates the percentage difference between the current closing price and the moving average's value. This indicates how far, in percentage terms, the price has deviated from that average. A positive percentage means the price is above the MA, while a negative percentage means it's below.
Displays Data in a Table: All the calculated information (MA type and length, its current value, and the percentage distance) is presented in a clear, organized table on the chart. This allows for quick at-a-glance monitoring.
Customizable Visibility: Users have the flexibility to show or hide the plots of the EMAs and SMAs on the chart, as well as the entire data table, through the indicator's settings.
Purpose:
The primary purpose of this indicator is to provide a concise overview of price momentum and potential overbought/oversold conditions relative to various moving averages. Traders often use the distance from MAs to:
Identify Trend Strength: A large distance from a long-term MA might suggest a strong trend.
Spot Potential Reversals: If the price is significantly extended from an MA, it might indicate that a pullback or reversal is due.
Confirm Support/Resistance: Moving averages often act as dynamic support or resistance levels, and their distance can provide context.
In essence, it helps you quickly see if the price is "stretched" or "compressed" relative to its historical averages, which can be valuable for making trading decisions.

Trend Confirmation StrategyComprehensive Trend Confirmation System
Indicator Features (Professional Description):
Comprehensive Trend Confirmation System is a versatile indicator meticulously designed to identify and confirm trend-based trading opportunities with exceptional efficiency. By seamlessly integrating analysis from a suite of leading technical tools, it aims to provide superior accuracy and reliability for informed trading decisions.
Key Features:
Intelligent Trend Identification: A robust trend analysis system that considers:
Adjustable Moving Averages: Utilizes three customizable moving average periods (fast, medium, slow) with user-selectable lengths and types (SMA, EMA, WMA, VWMA) to accurately determine the prevailing trend across different timeframes.
In-depth Price Action Analysis: Examines the formation of Higher Highs/Higher Lows (uptrend) and Lower Highs/Lower Lows (downtrend) to validate price direction.
Average Directional Index (ADX) with Adjustable Threshold: Measures the strength of a trend and employs the comparison between +DI and -DI to pinpoint the dominant momentum, featuring a customizable threshold to filter out weak signals.
Multi-Factor Signal Confirmation System: Enhances the reliability of trading signals through verification from four distinct confirmation tools:
Volume Analysis with Average Reference: Assesses whether trading volume supports price movements by comparing it to historical averages.
Relative Strength Index (RSI) with Reference Levels: Measures price momentum and identifies overbought/oversold conditions to confirm trend strength.
Moving Average Convergence Divergence (MACD) Divergence and Crossovers: Detects shifts in momentum and potential trend changes through the relationship between the MACD line and the Signal line.
Stochastic Oscillator with Reference Levels: Measures the current price's position relative to its historical range to evaluate overbought/oversold conditions and potential reversal opportunities.
Intelligent Signal Generation Logic:
Buy Signal: Triggered when a strong uptrend is identified (meeting defined criteria) and confirmed by at least three out of the four confirmation tools.
Sell Signal: Triggered when a strong downtrend is identified (meeting defined criteria) and confirmed by at least three out of the four confirmation tools.
User-Friendly Visualizations:
Moving Averages (MA): Displays three MA lines on the chart with user-configurable colors (default: fast-blue, medium-orange, slow-red) for easy visual trend analysis.
Clear Buy and Sell Signal Symbols: Presents distinct green upward-pointing triangles for buy signals and red downward-pointing triangles for sell signals at the corresponding candlestick.
Dynamic Candlestick Color Coding: Candlesticks are dynamically colored green upon a buy signal and red upon a sell signal for quick identification of trading opportunities.
Highly Customizable Parameters: Users have extensive control over the indicator's parameters, including:
Lengths and types of Moving Averages.
Length and Threshold of the ADX.
Length of the RSI.
Parameters for the MACD (Fast Length, Slow Length, Signal Length).
Parameters for the Stochastic Oscillator (%K Length, %D Length, Smoothing).
Ideal For:
Traders seeking a robust tool to accurately identify and confirm market trends.
Individuals aiming to reduce false signals and enhance the precision of their trading decisions.
Traders employing trend-following strategies in markets with clear directional movement.
Important Note:
While Comprehensive Trend Confirmation System is engineered to improve trading accuracy, no indicator can guarantee 100% profitable trades. Users are advised to utilize this indicator in conjunction with relevant fundamental analysis and sound risk management practices for optimal trading outcomes.

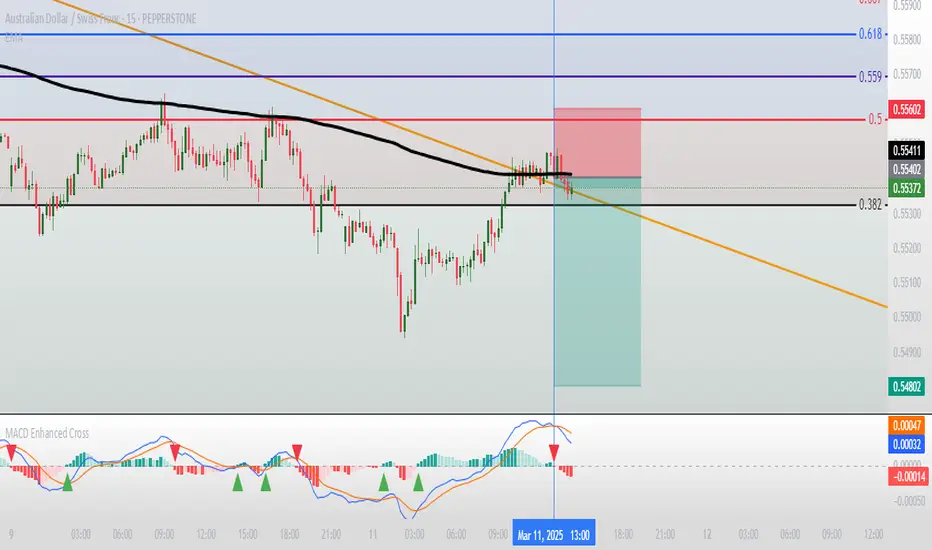
Moving Average Convergence Divergence with Enhanced Cross Alerts
Overview of Features and Settings
- Customizable Parameters:
- Fast and Slow Periods: Users can set the duration for both the fast (default 12) and slow (default 26) moving averages.
- Source Selection: The indicator uses the closing price (close) by default, though this can be modified to any other data source.
- Signal Smoothing: The smoothing period for the signal line is adjustable (default 9), and you can choose whether to use SMA or EMA for both the oscillator and the signal line calculations.
Calculation Logic
1. Calculation of Moving Averages:
- The fast and slow moving averages are computed based on the chosen moving average type (SMA or EMA) over the specified periods.
- The MACD line is then determined as the difference between these two moving averages.
2. Signal Line and Histogram:
- Signal Line: Created by smoothing the MACD line, with the option to choose between SMA and EMA.
- Histogram: Represents the difference between the MACD line and the signal line, visually indicating the divergence between the two.
Detection of Cross Events
The script identifies two specific cross events with additional filtering conditions:
- Bullish Cross:
- The MACD line **crosses above** the signal line.
- The previous value of the histogram is negative, and both the MACD and the signal line are below zero.
- This condition suggests that a cross occurring in the negative territory might indicate a potential upward trend reversal.
- **Bearish Cross:**
- The MACD line **crosses below** the signal line.
- The previous value of the histogram is positive, and both the MACD and the signal line are above zero.
- This condition indicates that a cross in the positive territory may signal a potential downward trend reversal.
For each event, there are dedicated alert conditions defined that trigger notifications when the criteria are met.
Visualization
- Displayed Elements:
- Histogram: Rendered as a column chart with colors that change based on the rate of change. For instance, a rising positive histogram uses a stronger green, whereas a declining positive histogram uses a lighter shade.
- MACD and Signal Lines: Displayed as separate lines with distinct colors to differentiate them.
- Zero Line: A horizontal line is drawn to help visually pinpoint the zero level.
- Crossing Signals:
- Optional markers in the form of arrows appear on the chart:
- **Bullish Cross: A green, upward-pointing triangle at the bottom.
- **Bearish Cross: A red, downward-pointing triangle at the top.
Summary
This indicator not only incorporates the traditional MACD components but also offers the following additional benefits:
- **Enhanced Accuracy:** Extra conditions (such as checking the previous histogram value and the position of the lines relative to zero) improve the identification of significant cross events.
- **Customization:** Users can personalize the moving average types and periods, making the indicator adaptable to different trading strategies.
- **Visual Assistance:** The combination of histogram columns, lines, and markers helps quickly pinpoint potential trend reversals, thereby aiding trading decisions.
This comprehensive description is intended to clearly demonstrate to users how the indicator works, outlining its calculations, filtering conditions, and its role in identifying cross events within technical analysis.
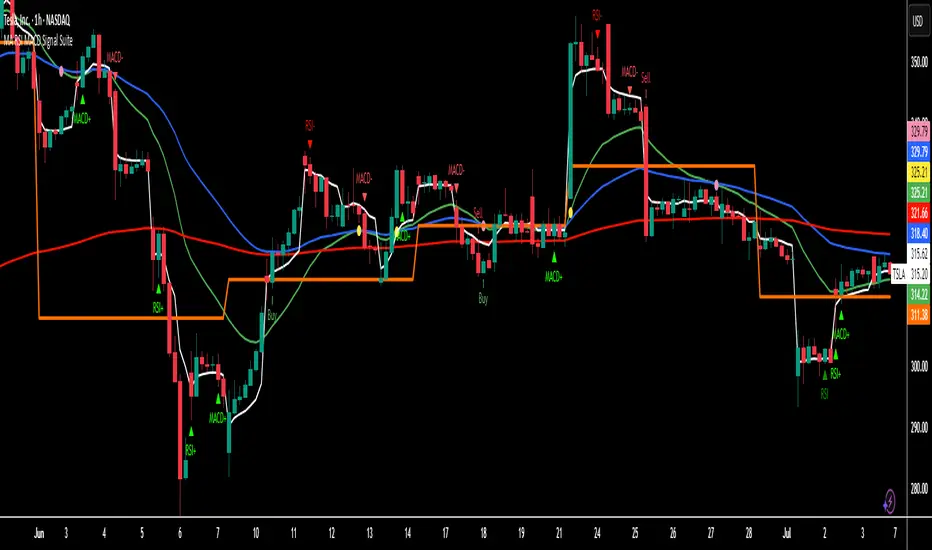
MA RSI MACD Signal SuiteThis Pine Script™ is designed for use in Trading View and generates trading signals based on moving average (MA) crossovers, RSI (Relative Strength Index) signals, and MACD (Moving Average Convergence Divergence) indicators. It provides visual markers on the chart and can be configured to suit various trading strategies.
1. Indicator Overview
The indicator includes signals for:
Moving Averages (MA): It tracks crossovers between different types of moving averages.
RSI: Signals based on RSI crossing certain levels or its signal line.
MACD: Buy and sell signals generated by MACD crossovers.
2. Inputs and Customization
Moving Averages (MAs):
You can customize up to 6 moving averages with different types, lengths, and colors.
MA Type: Choose from different types of moving averages:
SMA (Simple Moving Average)
EMA (Exponential Moving Average)
HMA (Hull Moving Average)
SMMA (RMA) (Smoothed Moving Average)
WMA (Weighted Moving Average)
VWMA (Volume Weighted Moving Average)
T3, DEMA, TEMA
Source: Select the price to base the MA on (e.g., close, open, high, low).
Length: Define the number of periods for each moving average.
Examples:
MA1: Exponential Moving Average (EMA) with a period of 9
MA2: Exponential Moving Average (EMA) with a period of 21
RSI Settings:
RSI is calculated based on a user-defined period and is used to identify potential overbought or oversold conditions.
RSI Length: Lookback period for RSI (default 14).
Overbought Level: Defines the overbought threshold for RSI (default 70).
Oversold Level: Defines the oversold threshold for RSI (default 30).
You can also adjust the smoothing for the RSI signal line and customize when to trigger buy and sell signals based on the RSI crossing these levels.
MACD Settings:
MACD is used for identifying changes in momentum and trends.
Fast Length: The period for the fast moving average (default 12).
Slow Length: The period for the slow moving average (default 26).
Signal Length: The period for the signal line (default 9).
Smoothing Method: Choose between SMA or EMA for both the MACD and the signal line.
3. Signal Logic
Moving Average (MA) Crossover Signals:
Crossover: A bullish signal is generated when a fast MA crosses above a slow MA.
Crossunder: A bearish signal is generated when a fast MA crosses below a slow MA.
The crossovers are plotted with distinct colors, and the chart will display markers for these crossover events.
RSI Signals:
Oversold Crossover: A bullish signal when RSI crosses over its signal line below the oversold level (30).
Overbought Crossunder: A bearish signal when RSI crosses under its signal line above the overbought level (70).
RSI signals are divided into:
Aggressive (Early) Entries: Signals when RSI is crossing the oversold/overbought levels.
Conservative Entries: Signals when RSI confirms a reversal after crossing these levels.
MACD Signals:
Buy Signal: Generated when the MACD line crosses above the signal line (bullish crossover).
Sell Signal: Generated when the MACD line crosses below the signal line (bearish crossunder).
Additionally, the MACD histogram is used to identify momentum shifts:
Rising to Falling Histogram: Alerts when the MACD histogram switches from rising to falling.
Falling to Rising Histogram: Alerts when the MACD histogram switches from falling to rising.
4. Visuals and Alerts
Plotting:
The script plots the following on the price chart:
Moving Averages (MA): The selected MAs are plotted as lines.
Buy/Sell Shapes: Triangular markers are displayed for buy and sell signals generated by RSI and MACD.
Crossover and Crossunder Markers: Crosses are shown when two MAs crossover or crossunder.
Alerts:
Alerts can be configured based on the following conditions:
RSI Signals: Alerts for oversold or overbought crossover and crossunder events.
MACD Signals: Alerts for MACD line crossovers or momentum shifts in the MACD histogram.
Alerts are triggered when specific conditions are met, such as:
RSI crosses over or under the oversold/overbought levels.
MACD crosses the signal line.
Changes in the MACD histogram.
5. Example Usage
1. Trend Reversal Setup:
Buy Signal: Use the RSI oversold crossover and MACD bullish crossover to identify potential entry points in a downtrend.
Sell Signal: Use the RSI overbought crossunder and MACD bearish crossunder to identify potential exit points or short entries in an uptrend.
2. Momentum Strategy:
Combine MACD and RSI signals to identify the strength of a trend. Use MACD histogram analysis and RSI levels for confirmation.
3. Moving Average Crossover Strategy:
Focus on specific MA crossovers, such as the 9-period EMA crossing above the 21-period EMA, for buy signals. When a longer-term MA (e.g., 50-period) crosses a shorter-term MA, it may indicate a strong trend change.
6. Alerts Conditions
The script includes several alert conditions, which can be triggered and customized based on the user’s preferences:
RSI Oversold Crossover: Alerts when RSI crosses over the signal line below the oversold level (30).
RSI Overbought Crossunder: Alerts when RSI crosses under the signal line above the overbought level (70).
MACD Buy/Sell Crossover: Alerts when the MACD line crosses the signal line for a buy or sell signal.
7. Conclusion
This script is highly customizable and can be adjusted to suit different trading strategies. By combining MAs, RSI, and MACD, traders can gain multiple perspectives on the market, enhancing their ability to identify potential buy and sell opportunities.
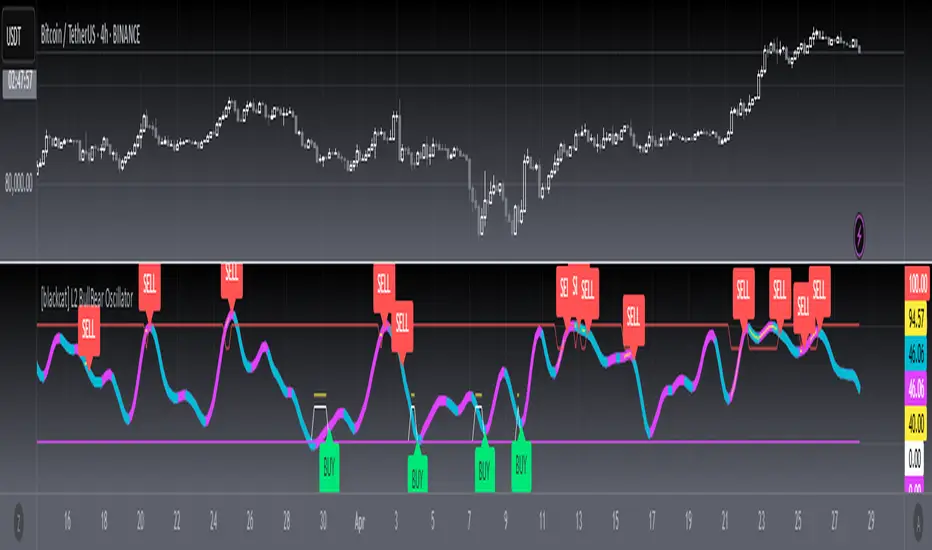
[blackcat] L2 BullBear OscillatorOVERVIEW
The " L2 BullBear Oscillator" is a custom trading indicator for TradingView that helps traders identify market trends, potential tops and bottoms, and the strength of trends using various moving averages and price relationships.
FEATURES
Calculates a base oscillator based on the close price relative to the highest and lowest prices over the past 60 periods.
Smoothes the oscillator using exponential moving averages (EMAs).
Determines market strength through relative strength indicators and moving averages.
Identifies potential tops and strong support levels based on specific conditions involving oscillators and price actions.
Plots several signals to help traders make informed decisions.
HOW TO USE
Install the script on your TradingView chart.
Customize the settings in the "Inputs" section:
Set the periods for the short-term and long-term EMAs.
Set the periods for the three SMAs used in calculations.
Interpret the plots:
BullBear Signal (Fuchsia Line): Indicates the overall market trend. Uptrends suggest buying opportunities, while downtrends suggest selling.
Decreasing BullBear Signal (Aqua Line): Highlights periods when the trend is weakening or turning bearish, signaling possible selling opportunities.
Potential Top Condition (Yellow Plot): Signals possible trend reversals from bullish to bearish, indicating times to consider taking profits or preparing for a downtrend.
High Price Condition (Yellow Plot): Indicates strong bullish momentum but also potentially overbought conditions, which might precede a correction.
Earning Condition (Red Line): Possibly signifies strong bullish signals, indicating good times to enter long positions.
Strong Support Condition (White Arrows): Signals potential bottoms or support levels, indicating buying opportunities.
Start Hiding Condition (Fuchsia Plot): Might indicate times to exit positions or reduce exposure due to unfavorable market conditions.
ALGORITHMS
Moving Averages:
Simple Moving Averages (SMAs): Used to calculate averages of price data over specified periods.
Exponential Moving Averages (EMAs): Used to give more weight to recent prices, making the moving averages more responsive to new data.
Oscillator Calculation:
The base oscillator is calculated based on the close price's position within the highest and lowest prices over 60 periods, normalized to a 0-100 scale.
This oscillator is then smoothed using EMAs to reduce noise and make trends more visible.
Relative Strength Indicator:
Calculated based on the close price's position within the highest and lowest prices over 20 periods, also normalized to a 0-100 scale.
This is smoothed using SMAs to get a more stable signal.
Condition Checks:
Various conditions are checked to identify potential tops, strong support, and other market states based on the relationships between these indicators and price actions.
LIMITATIONS
The script is based on historical data and does not guarantee future performance.
It is recommended to use the script in conjunction with other analysis tools.
The effectiveness of the strategy may vary depending on the market conditions and asset being traded.
NOTES
The script is designed for educational purposes and should not be considered financial advice.
Users are encouraged to backtest the strategy on a demo account before applying it to live trades.
THANKS
Special thanks to the TradingView community for their support and feedback.
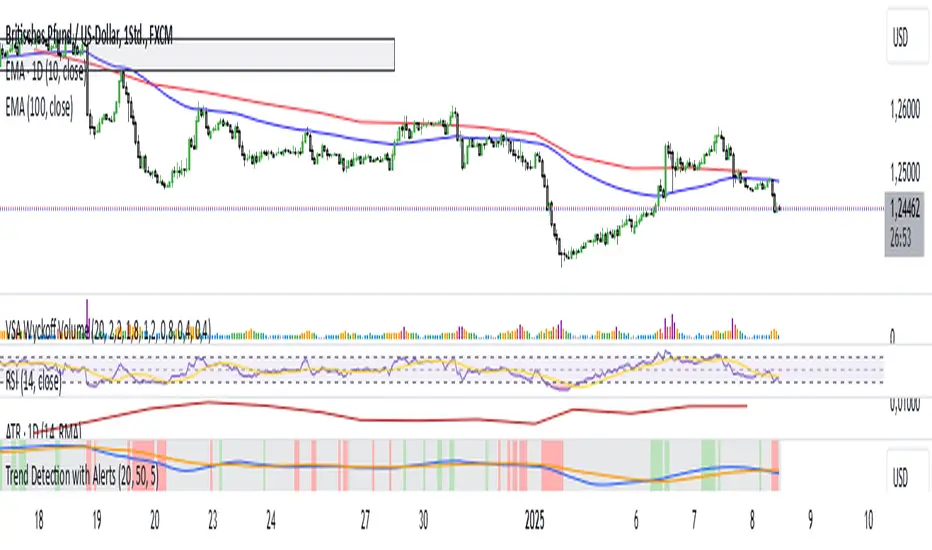
Trend Detection with AlertsPurpose of the Script
The script identifies trends on a chart (uptrend, downtrend, or sideways trend) and provides both visual cues and alerts when a trend changes. It uses two methods for trend detection:
Moving Averages (MA): It compares a short-term moving average (fast) with a long-term moving average (slow).
An uptrend occurs when the short-term MA is above the long-term MA.
A downtrend occurs when the short-term MA is below the long-term MA.
Price Action:
Higher highs (HH) indicate bullish momentum.
Lower lows (LL) indicate bearish momentum.
When these methods align, the script determines the trend and notifies the user of any trend changes.
Key Features
Moving Average Calculation:
A short-term moving average and a long-term moving average are calculated to determine the overall trend direction.
Trend Determination:
An uptrend is detected when the short-term MA is above the long-term MA and higher highs are present.
A downtrend is detected when the short-term MA is below the long-term MA and lower lows are present.
Otherwise, the trend is classified as sideways.
Alerts for Trend Changes:
Alerts are triggered when the trend changes from one state to another (e.g., sideways to uptrend).
Custom messages indicate the type of trend detected.
Background Colors:
The script changes the chart’s background color based on the current trend:
Green for uptrends.
Red for downtrends.
Gray for sideways trends.
Visualization of Moving Averages:
The moving averages are plotted on the chart for visual reference.
How It Works
Inputs for Flexibility:
The user can configure the lengths of the short-term and long-term moving averages.
A lookback period is used to determine higher highs or lower lows for additional confirmation.
Trend Logic:
The script checks the relationship between the moving averages to identify general trends.
It also evaluates price action to confirm trend strength (e.g., whether a higher high or lower low occurred).
Alert System:
When the detected trend changes (e.g., from sideways to uptrend), an alert is triggered. This ensures the user is notified of important market movements.
Dynamic Background Coloring:
The background color of the chart changes to reflect the current trend, making it easy to interpret the trend visually.
Use Cases
Trend Identification: Helps traders quickly identify market trends for decision-making.
Alerts for Trend Changes: Notifies traders when a new trend begins, ensuring they don’t miss key opportunities.
Visual Assistance: Makes it easier to interpret trends through color-coded backgrounds and moving average overlays.
Customization Options
Adjust Moving Average Lengths: Users can modify the short-term and long-term moving averages to suit their trading strategies.
Change Lookback Period: The sensitivity of higher highs and lower lows can be adjusted.
Personalized Alerts: Alerts can be customized for different trading scenarios.
Summary
This script provides an intuitive way to detect and visualize market trends while offering real-time alerts for trend changes. It’s an excellent tool for traders who want to stay informed about market conditions and make data-driven decisions.
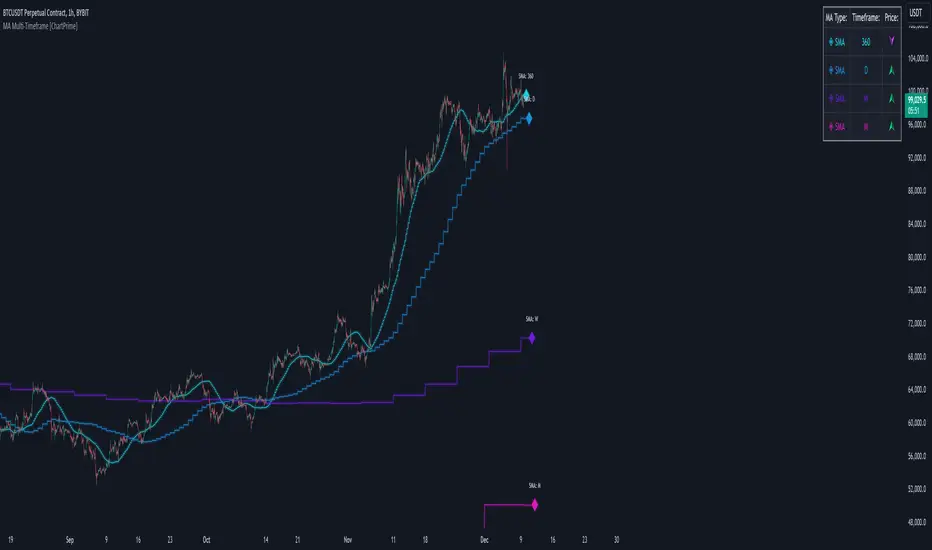
MA Multi-Timeframe [ChartPrime]The MA Multi-Timeframe indicator is designed to provide multi-timeframe moving averages (MAs) for better trend analysis across different periods. This tool allows traders to monitor up to four different MAs on a single chart, each coming from a selectable timeframe and type (SMA, EMA, SMMA, WMA, VWMA). The indicator helps traders gauge both short-term and long-term price trends, allowing for a clearer understanding of market dynamics.
⯁ KEY FEATURES AND HOW TO USE
⯌ Multi-Timeframe Moving Averages :
The indicator allows traders to select up to four MAs, each from different timeframes. These timeframes can be set in the input settings (e.g., Daily, Weekly, Monthly), and each moving average can be displayed with its corresponding timeframe label directly on the chart.
Example of different timeframes for MAs:
⯌ Moving Average Types :
Users can choose from several types of moving averages, including SMA, EMA, SMMA, WMA, and VWMA, making the indicator adaptable to different strategies and market conditions. This flexibility allows traders to tailor the MAs to their preference.
Example of different types of MAs:
⯌ Dashboard Display :
The indicator includes a built-in dashboard that shows each MA, its timeframe, and whether the price is currently above or below that MA. This dashboard provides a quick overview of the trend across different timeframes, allowing traders to determine whether the overall trend is up or down.
Example of trend overview via the dashboard:
⯌ Polyline Representation :
Each MA is plotted using polylines to avoid plot functions and create a curves across up to 4000 bars back, ensuring that historical data is visualized clearly for a deeper analysis of how the price interacts with these levels over time.
if barstate.islast
for i = 0 to 4000
cp.push(chart.point.from_index(bar_index , ma ))
polyline.delete(polyline.new(cp, curved = false, line_color = color, line_style = style) )
Example of polylines for moving averages:
⯌ Customization Options :
Traders can customize the length of the MAs for all timeframes using a single input. The color, style (solid, dashed, dotted) of each moving average are also customizable, giving users full control over the visual appearance of the indicator on their chart.
Example of custom MA styles:
⯁ USER INPUTS
MA Type : Select the type of moving average for each timeframe (SMA, EMA, SMMA, WMA, VWMA).
Timeframe : Choose the timeframe for each moving average (e.g., Daily, Weekly, Monthly).
MA Length : Set the length for the moving averages, which will be applied to all four MAs.
Line Style : Customize the style of each MA line (solid, dashed, or dotted).
Colors : Set the color for each MA for better visual distinction.
⯁ CONCLUSION
The MA Multi-Timeframe indicator is a versatile and powerful tool for traders looking to monitor price trends across multiple timeframes with different types of moving averages. The dashboard simplifies trend identification, while the customizable options make it easy to adapt to individual trading strategies. Whether you're analyzing short-term price movements or long-term trends, this indicator offers a comprehensive solution for tracking market direction.
Atlantean Bitcoin Weekly Market Condition - Top/Bottom BTC Overview:
The "Atlantean Bitcoin Weekly Market Condition Detector - Top/Bottom BTC" is a specialized TradingView indicator designed to identify significant turning points in the Bitcoin market on a weekly basis. By analyzing long-term and short-term moving averages across two distinct resolutions, this indicator provides traders with valuable insights into potential market bottoms and tops, as well as the initiation of bull markets.
Key Features:
Market Bottom Detection: The script uses a combination of a simple moving average (SMA) and an exponential moving average (EMA) calculated over long and short periods to identify potential market bottoms. When these conditions are met, the script signals a "Market Bottom" label on the chart, indicating a possible buying opportunity.
Bull Market Start Indicator: When the short-term EMA crosses above the long-term SMA, it signals the beginning of a bull market. This is marked by a "Bull Market Start" label on the chart, helping traders to prepare for potential market upswings.
Market Top Detection: The script identifies potential market tops by analyzing the crossunder of long and short-term moving averages. A "Market Top" label is plotted, suggesting a potential selling point.
Customizable Moving Averages Display: Users can choose to display the moving averages used for detecting market tops and bottoms, providing additional insights into market conditions.
How It Works: The indicator operates by monitoring the interactions between the specified moving averages:
Market Bottom: Detected when the long-term SMA (adjusted by a factor of 0.745) crosses over the short-term EMA.
Bull Market Start: Detected when the short-term EMA crosses above the long-term SMA.
Market Top: Detected when the long-term SMA (adjusted by a factor of 2) crosses under the short-term SMA.
These conditions are highlighted on the chart, allowing traders to visualize significant market events and make informed decisions.
Intended Use: This indicator is best used on weekly Bitcoin charts. It’s designed to provide long-term market insights rather than short-term trading signals. Traders can use this tool to identify strategic entry and exit points during major market cycles. The optional display of moving averages can further enhance understanding of market dynamics.
Originality and Utility: Unlike many other indicators, this script not only highlights traditional market tops and bottoms but also identifies the aggressive start of bull markets, offering a comprehensive view of market conditions. The unique combination of adjusted moving averages makes this script a valuable tool for long-term Bitcoin traders.
Disclaimer: The signals provided by this indicator are based on historical data and mathematical calculations. They do not guarantee future market performance. Traders should use this tool as part of a broader trading strategy and consider other factors before making trading decisions. Not financial advice.
Happy Trading!
By Atlantean

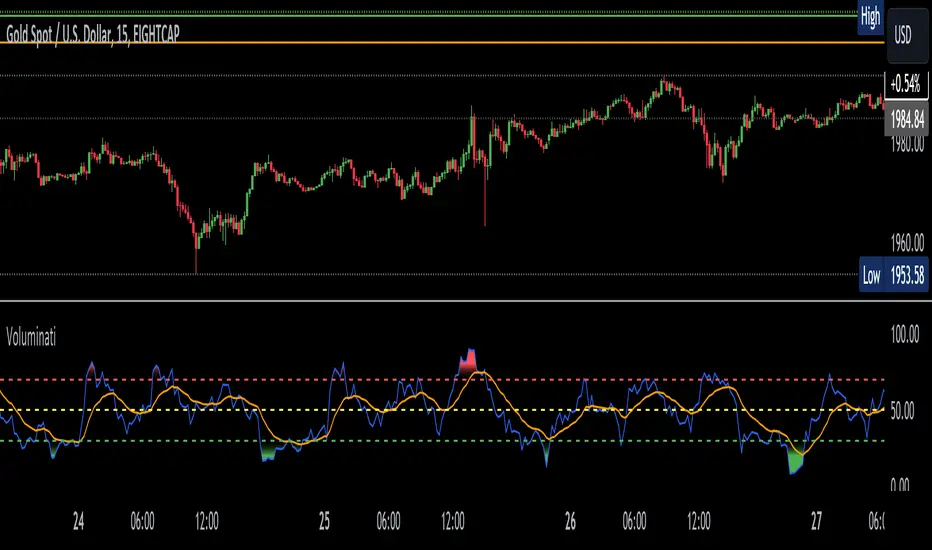
Voluminati: Uncovering Market SecretsVoluminati: Uncovering Market Secrets
Overview:
The Voluminati indicator dives deep into the secrets of trading volume, providing traders with unique insights into the market's strength and direction. This advanced tool visualizes the Relative Strength Index (RSI) of trading volume alongside the traditional RSI of price, presenting an enriched perspective on market dynamics.
Features:
Volume RSI: A unique twist on the traditional RSI, the Volume RSI measures the momentum of trading volume. This can help identify periods of increasing buying or selling pressure.
Traditional RSI: The renowned momentum oscillator that measures the speed and change of price movements. Useful for identifying overbought or oversold conditions.
Moving Averages: Both the Volume RSI and traditional RSI come with optional moving averages. These can be toggled on or off and are customizable in type (SMA or EMA) and length.
Overbought & Oversold Fills: Visual aids that highlight regions where the Volume RSI is in overbought (above 70) or oversold (below 30) territories. These fills help traders quickly identify potential reversal zones.
How to Use:
Look for divergence between the Volume RSI and price, which can indicate potential reversals.
When the Volume RSI moves above 70, it might indicate overbought conditions, and when it moves below 30, it might indicate oversold conditions.
The optional moving averages can be used to identify potential crossover signals or to smooth out the oscillators for a clearer trend view.
Customizations:
Toggle the display of the traditional RSI and its moving average.
Choose the type (SMA/EMA) and length for both the Volume RSI and traditional RSI moving averages.
Note: Like all indicators, the Voluminati is best used in conjunction with other tools and analysis techniques. Always use proper risk management.
Enhanced Cumulative Volume Delta + MAThe Enhanced Cumulative Volume Delta (CVD) indicator is designed to help traders analyze the cumulative buying and selling pressure in the market by examining the delta between the up and down volume. By tracking this metric, traders can gain insights into the strength of a trend and potential reversals. This indicator uses advanced volume analysis combined with customizable moving averages to provide a more detailed view of market dynamics.
How to Use This Indicator:
Volume Delta Visualization:
The indicator plots the cumulative volume delta (CVD) using color-coded candles, where teal represents positive delta (buying pressure) and soft red represents negative delta (selling pressure).
Moving Averages:
Use the moving averages to smooth the CVD data and identify long-term trends. You can choose between SMA and EMA for each of the three available moving averages. The first and third moving averages are typically used for short-term and long-term trend analysis, respectively, while the second moving average can serve as a medium-term filter.
Arrow Markers:
The indicator will display arrows (green triangle up for crossing above, red triangle down for crossing below) when the CVD volume crosses the 3rd moving average. You can control the visibility of these arrows through the input parameters.
Volume Data:
The indicator provides error handling in case no volume data is available for the selected symbol, ensuring that you're not misled by incomplete data.
Practical Applications:
Trend Confirmation: Use the CVD and moving averages to confirm the overall trend direction and strength. Positive delta and a rising CVD can confirm an uptrend, while negative delta and a falling CVD indicate a downtrend.
Volume Breakouts: The arrows marking when the CVD crosses the 3rd moving average can help you spot potential volume breakouts or reversals, making them useful for entry or exit signals.
Volume Divergence: Pay attention to divergences between price and CVD, as these can often signal potential trend reversals or weakening momentum.

Cross Alert with Configurable Rectangles**Description:**
This TradingView script, **"Cross Alert with Configurable Rectangles"**, is a technical analysis tool designed to help traders visualize and analyze market trends effectively. It combines configurable moving averages with customizable timeframe-based rectangles for highlighting price ranges.
### Features:
1. **Moving Averages:**
- Calculates and plots an Exponential Moving Average (EMA) and a Simple Moving Average (SMA) based on user-defined lengths.
- Provides both short and long moving averages to identify potential trend reversals or confirmations.
2. **Customizable Timeframe Rectangles:**
- Dynamically draws rectangles around price action based on user-selected timeframes: **Hourly (60 minutes), Daily, Weekly, or Monthly.**
- Automatically updates the rectangles to reflect high and low price levels within the selected timeframe.
- Customizable rectangle color and transparency for better chart visibility.
3. **Dynamic Line Projections:**
- Projects the trend of the long and short moving averages forward in time to help anticipate price movements.
### Use Case:
This script is ideal for traders who want to:
- Identify key support and resistance levels within different timeframes.
- Analyze price behavior relative to moving averages.
- Spot potential trend changes by observing price interaction with the moving averages and timeframe rectangles.
The script is fully configurable, allowing traders to adapt it to their trading strategy and preferences.

Volume-Based RSI Color Indicator with MAsVolume-Based RSI Color Indicator with MAs
Overview
This script combines the Relative Strength Index (RSI) with volume analysis to provide an enhanced perspective on market conditions. By dynamically coloring the RSI line based on overbought/oversold conditions and volume thresholds, this indicator helps traders quickly identify high-probability reversal zones. Additionally, it incorporates short-term and long-term moving averages (MAs) of the RSI for trend analysis, making it a versatile tool for scalping and swing trading strategies.
Key Features
Dynamic RSI Color Coding:
The RSI line changes color based on two conditions:
Overbought/High Volume: RSI is above the overbought threshold (default: 70) and volume exceeds the average volume by a user-defined multiplier (default: 2.0). The line turns red, indicating potential reversal zones.
Oversold/High Volume: RSI is below the oversold threshold (default: 30) and volume exceeds the average volume by the multiplier. The line turns green, suggesting potential buying opportunities.
Neutral Conditions: Default blue color for all other scenarios.
Volume Integration:
Unlike standard RSI indicators, this script incorporates volume data to refine signals, helping traders avoid false signals in low-volume environments.
RSI Moving Averages:
Two moving averages of the RSI (short-term and long-term) provide trend context:
200-period MA: Highlights the long-term trend in RSI values.
20-period MA: Shows short-term fluctuations for quick decision-making.
Both MAs can be calculated using Simple or Exponential methods, giving users flexibility.
Visual Aids:
Horizontal lines at the overbought (70) and oversold (30) levels help define the boundaries of expected price action extremes.
How It Works
The script calculates the RSI over a user-defined length (default: 14).
Volume data is compared to its moving average to determine if it exceeds the user-defined high-volume threshold.
When RSI and volume conditions align, the RSI line is dynamically colored to indicate potential overbought/oversold zones.
The RSI moving averages provide additional context to confirm trends or reversals.
How to Use
Identify Reversal Zones:
Look for green RSI signals in oversold conditions to identify potential buying opportunities.
Look for red RSI signals in overbought conditions to identify potential selling opportunities.
Use Moving Averages for Confirmation:
When the RSI is above its 200-period MA, the long-term trend is bullish; consider only long trades.
When the RSI is below its 200-period MA, the trend is bearish; consider only short trades.
Combine with Other Tools:
This indicator works best when used alongside price action analysis, candlestick patterns, or support/resistance levels.
Originality
This script is unique in combining volume analysis with RSI and RSI-specific moving averages. While many indicators focus on RSI or volume separately, this script marries these two key metrics to filter out weak signals and improve trade decision accuracy.
Chart Recommendations
Clean Chart: Use this indicator on a clean chart without additional overlays for maximum clarity.
Timeframes: Works well on intraday charts (e.g., 5m, 15m) for scalping and on higher timeframes (e.g., 1H, 4H, Daily) for swing trading.
Disclaimer
This indicator is a tool to aid trading decisions and should not be used in isolation. Always consider other factors such as market conditions, news events, and risk management.
